创建逻辑回归分类器
尽管名称中存在词回归, 但是逻辑回归实际上用于分类目的. 给定一组数据点, 我们的目标是构建一个可以在我们的类之间绘制线性边界的模型. 它通过求解从训练数据导出的一组方程来提取这些边界.
怎么做...?
- 让我们看看如何在Python中做到这一点. 我们将使用提供给您的logistic_regression.py文件作为参考. 假设您导入了必要的包, 让我们创建一些示例数据以及训练标签:
import numpy as np
from sklearn import linear_model
import matplotlib.pyplot as plt

X = np.array(
    [
        [4, 7], [3.5, 8], [3.1, 6.2],
        [0.5, 1], [1, 2], [1.2, 1.9],
        [6, 2], [5.7, 1.5], [5.4, 2.2]
    ]
)
y = np.array([0, 0, 0, 1, 1, 1, 2, 2, 2])

# 这里我们假设有3个分类
- 初始化逻辑回归器
classifier = linear_model.LogisticRegression(solver='liblinear', C=100)
# 有许多可以指定的前置参数,但是一些重要的输入参数是solver和C.
# solver参数指定算法将用于求解方程组的求解器的类型.
# C参数控制正则化强度(较低的值表示较高的正则化强度)
- 训练分类器
classifier.fit(X, y)
- 画出点和边界.
def plot_classifier(classifier, X, y):
    # define ranges to plot the figure
    x_min, x_max = min(X[:, 0]) - 1.0, max(X[:, 0]) + 1.0
    y_min, y_max = min(X[:, 1]) - 1.0, max(X[:, 1]) + 1.0

    # denotes the step size that will be used in the mesh grid
    step_size = 0.01

    # define the mesh grid
    x_values, y_values = np.meshgrid(
        np.arange(x_min, x_max, step_size), np.arange(y_min, y_max, step_size))

    # compute the classifier output
    mesh_output = classifier.predict(np.c_[x_values.ravel(), y_values.ravel()])

    # reshape the array
    mesh_output = mesh_output.reshape(x_values.shape)

    # Plot the output using a colored plot
    plt.figure()

    # choose a color scheme you can find all the options
    # here: http://matplotlib.org/examples/color/colormaps_reference.html
    plt.pcolormesh(x_values, y_values, mesh_output, cmap=plt.cm.gray)

    # Overlay the training points on the plot
    plt.scatter(
        X[:, 0],
        X[:, 1],
        c=y,
        s=80,
        edgecolors='black',
        linewidth=1,
        cmap=plt.cm.Paired
    )

    # specify the boundaries of the figure
    plt.xlim(x_values.min(), x_values.max())
    plt.ylim(y_values.min(), y_values.max())

    # specify the ticks on the X and Y axes
    plt.xticks((np.arange(int(min(X[:, 0]) - 1), int(max(X[:, 0]) + 1), 1.0)))
    plt.yticks((np.arange(int(min(X[:, 1]) - 1), int(max(X[:, 1]) + 1), 1.0)))

    plt.show()

plot_classifier(classifier, X, y)
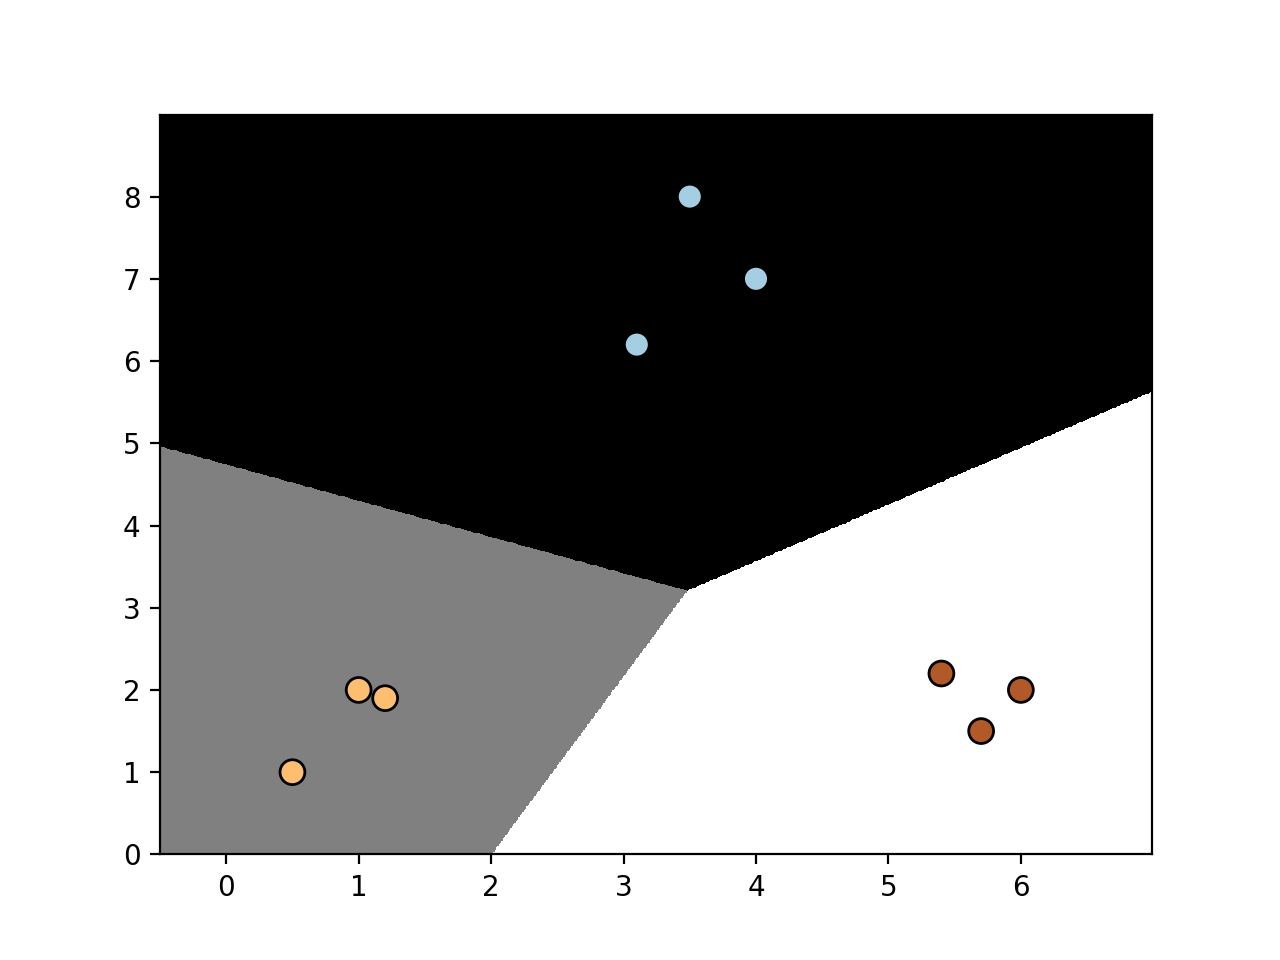
- 运行以上代码可以得到如下图形:

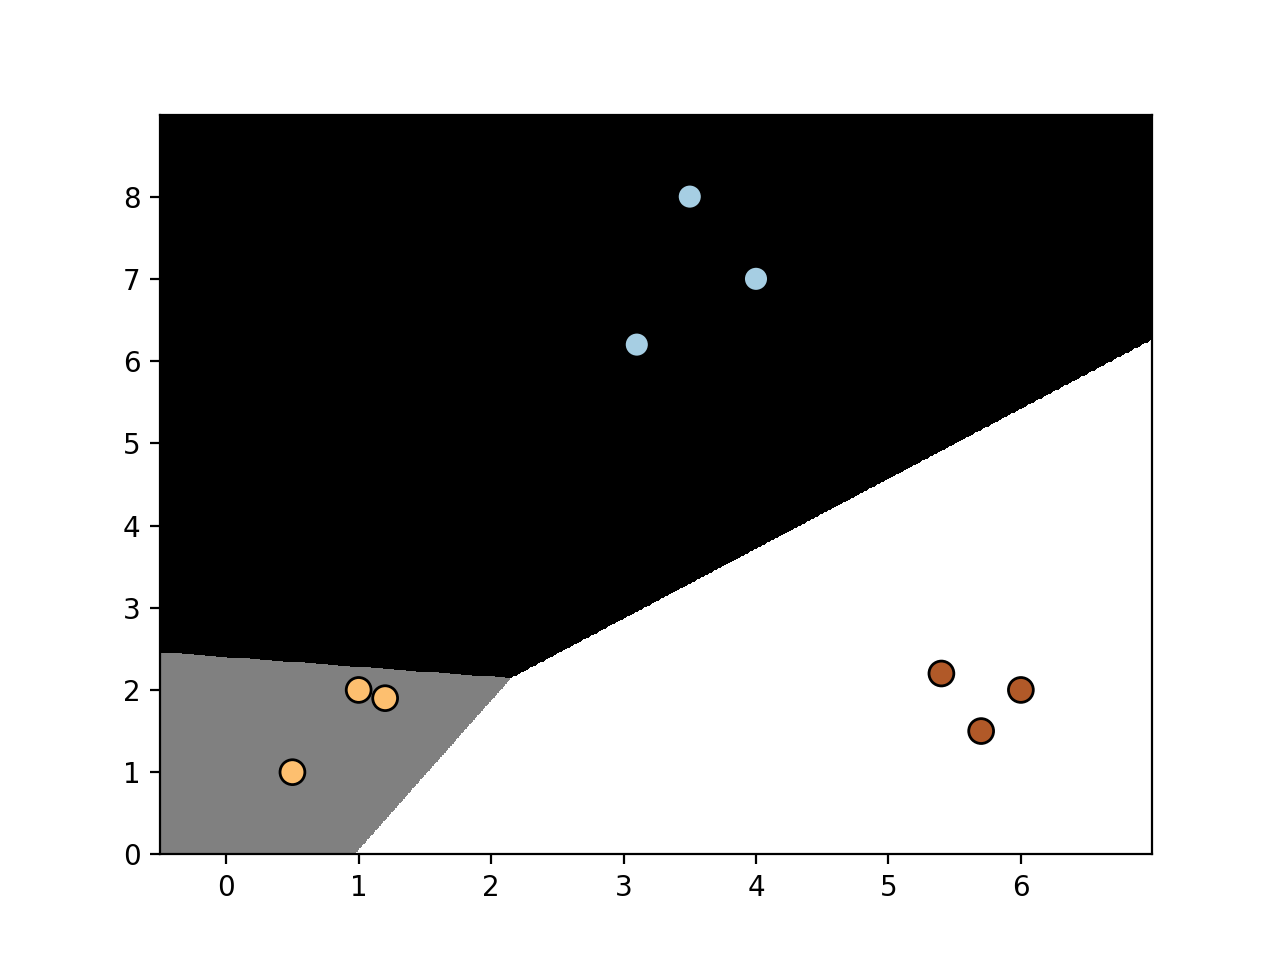
- 修改参数C的值为1.0, 将得到如下图形:

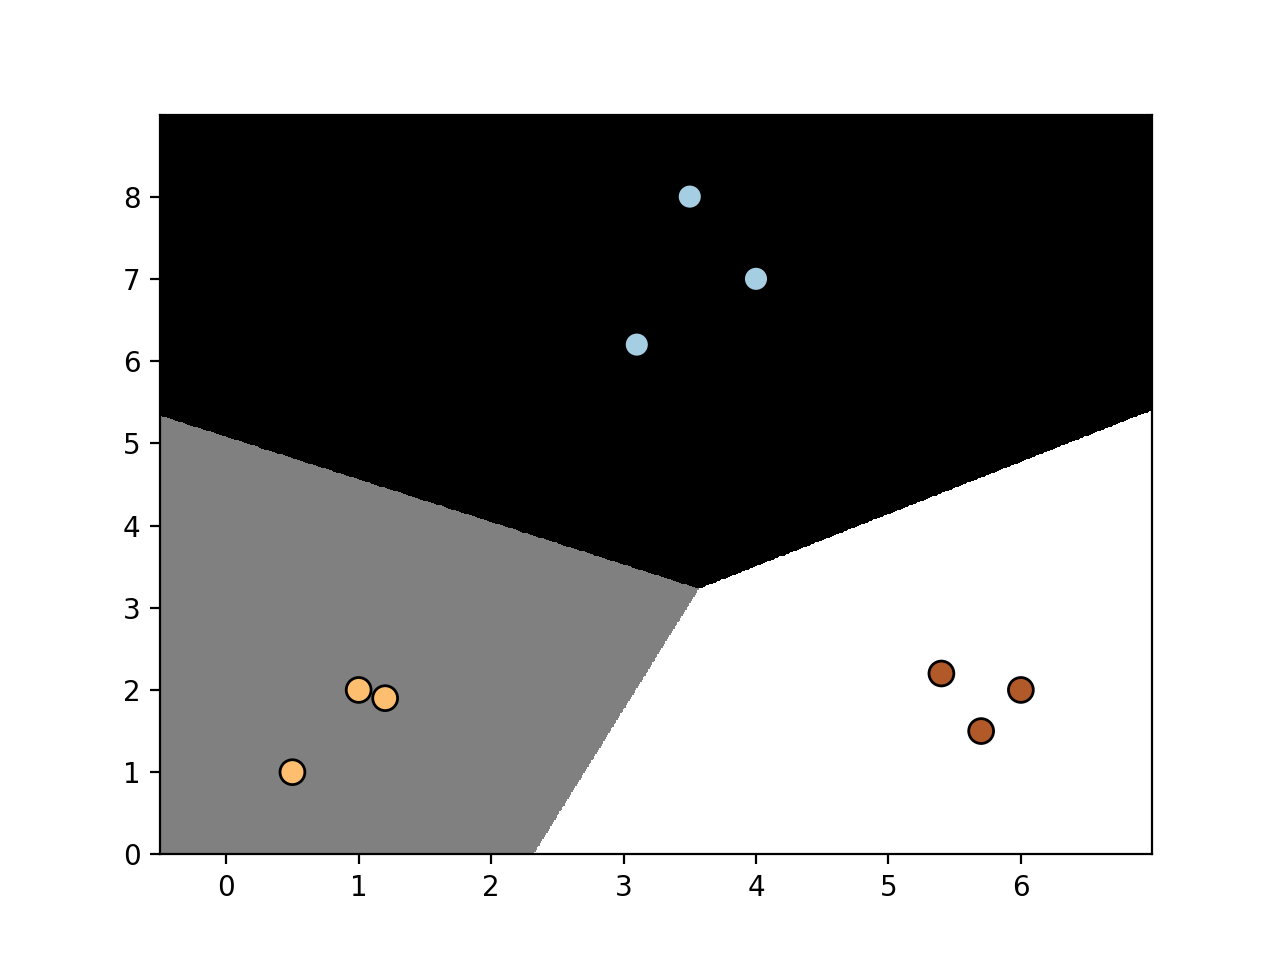
- 再次修改参数C的值为10000:

当我们增加C时, 对错误分类有更高的惩罚. 因此, 边界得到更优化.