Mean Shift是一种强大的无监督学习算法, 用于对数据点进行聚类. 它将数据点的分布视为概率密度函数, 并尝试在特征空间中找到模式. 这些模式基本上是对应于局部最大值的点. Mean Shift算法的主要优点是我们不需要事先知道簇的数量.
假设我们有一组输入点, 我们正在尝试在其中找到集群, 而不知道我们正在寻找多少个集群. Mean Shift算法将这些点从概率密度函数中进行采样. 如果数据点中存在簇, 则它们对应于该概率密度函数的峰值. 该算法从随机点开始, 并逐渐收敛于这些峰值. 您可以在http://homepages.inf.ed.ac.uk/rbf/CVonline/LOCAL_COPIES/TUZEL1/MeanShift.pdf了解更多信息.
怎么做...?
- 该食谱的完整代码在mean_shift.py文件中给出. 我们来看看它是如何构建的. 创建一个新的Python文件, 并导入几个必需的包:
import numpy as np
from sklearn.cluster import MeanShift, estimate_bandwidth
import matplotlib.pyplot as plt
import utilities
- 从data_multivar.txt文件中导入数据:
# Load data from input file
X = utilities.load_data('data_multivar.txt')
- 通过指定输入参数构建Mean Shift聚类模型:
# Estimating the bandwidth
bandwidth = estimate_bandwidth(X, quantile=0.1, n_samples=len(X))

# Compute clustering with MeanShift
meanshift_estimator = MeanShift(bandwidth=bandwidth, bin_seeding=True)
- 训练模型:
meanshift_estimator.fit(X)
- 获取标签:
labels = meanshift_estimator.labels_
- 从模型中提取聚类的质心并打印出聚类数:
centroids = meanshift_estimator.cluster_centers_
num_clusters = len(np.unique(labels))

print ("Number of clusters in input data =", num_clusters)
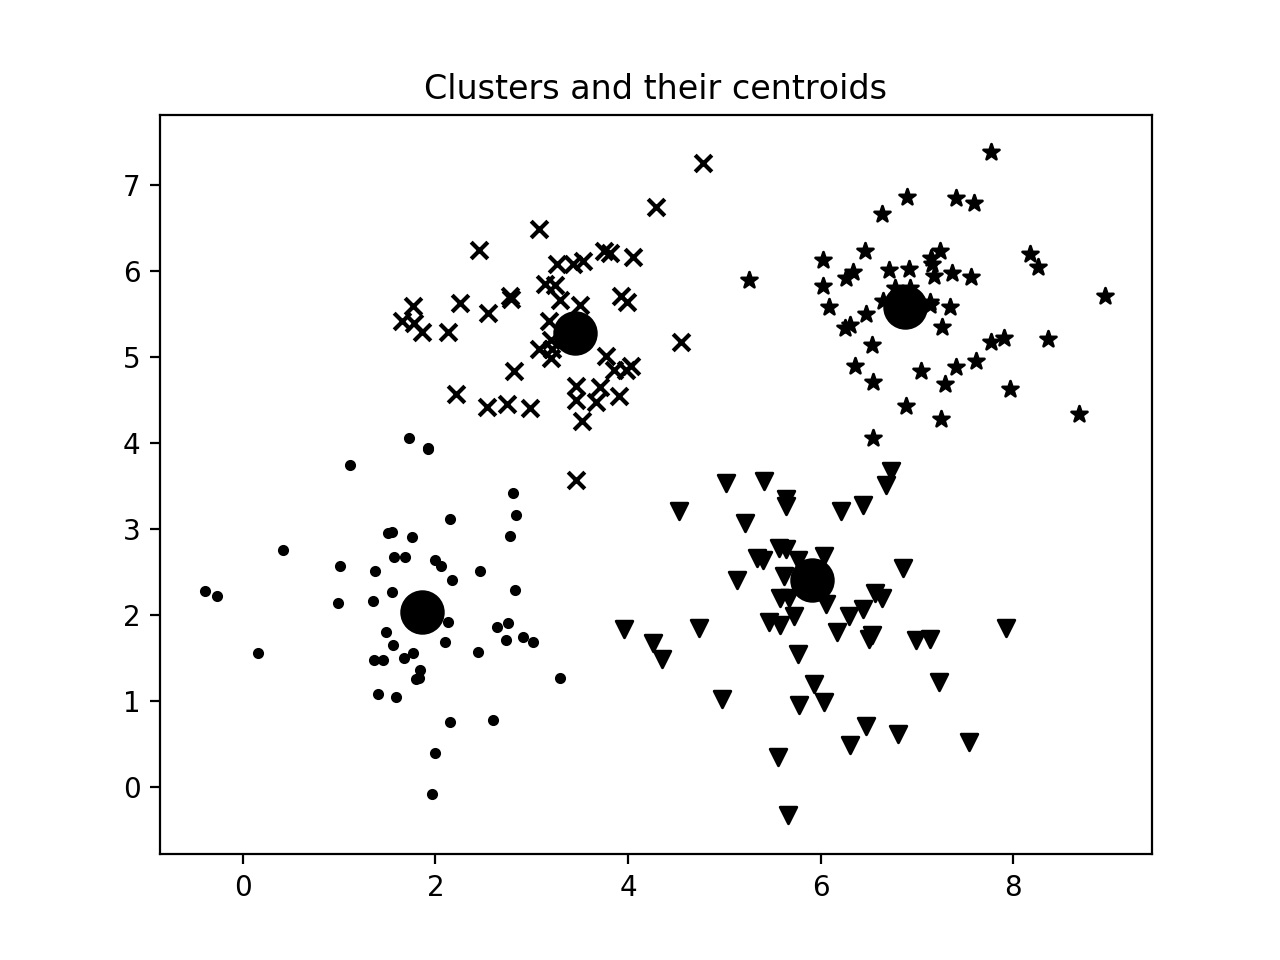
- 图形可视化:
###########################################################
# Plot the points and centroids
plt.figure()

# specify marker shapes for different clusters
markers = '.*xv'

for i, marker in zip(range(num_clusters), markers):
    # plot the points belong to the current cluster
    plt.scatter(X[labels == i, 0], X[labels == i, 1], marker=marker, color='k')

    # plot the centroid of the current cluster
    centroid = centroids[i]
    plt.plot(centroid[0], centroid[1], marker='o', markerfacecolor='k',
             markeredgecolor='k', markersize=15)

plt.title('Clusters and their centroids')
plt.show()
