根据汽车的特性评估汽车
让我们看看我们如何应用分类技术到现实世界的问题. 我们将使用一个数据集, 其中包含有关汽车的一些详细信息, 例如门数, 引导空间, 维护成本等. 我们的目标是确定汽车的质量. 为了分类的目的, 质量可以采取四个值: 不可接受的, 可接受的, 良好的和非常好.
准备
您可以下载数据集: https://archive.ics.uci.edu/ml/datasets/Car+Evaluation.
您需要将数据集中的每个值视为字符串. 我们考虑数据集中的六个属性. 这里是属性以及可能的值:
- buying: 4种可选值: vhigh, high, med, low
- maint: 4种可选值: vhigh, high, med, low
- doors: 2, 3, 4, 5或more
- persons: 2, 4 或 more
- lug_boot: small, med, big
- safety: low, med, high
假设每行包含字符串, 我们需要假设所有的特征都是字符串并设计一个分类器. 在上一章中, 我们使用随机森林构建回归. 在本章中, 我们将使用随机森林作为分类器.
怎么做...?
- 将以下代码添加到相同的python文件中:
from sklearn.model_selection import validation_curve

classifier = RandomForestClassifier(max_depth=4, random_state=7)
parameter_grid = np.linspace(25, 200, 8).astype(int)
train_scores, validation_scores = validation_curve(
    classifier,
    X,
    y,
    "n_estimators",
    parameter_grid,
    cv=5
)
print ("##### VALIDATION CURVES #####")
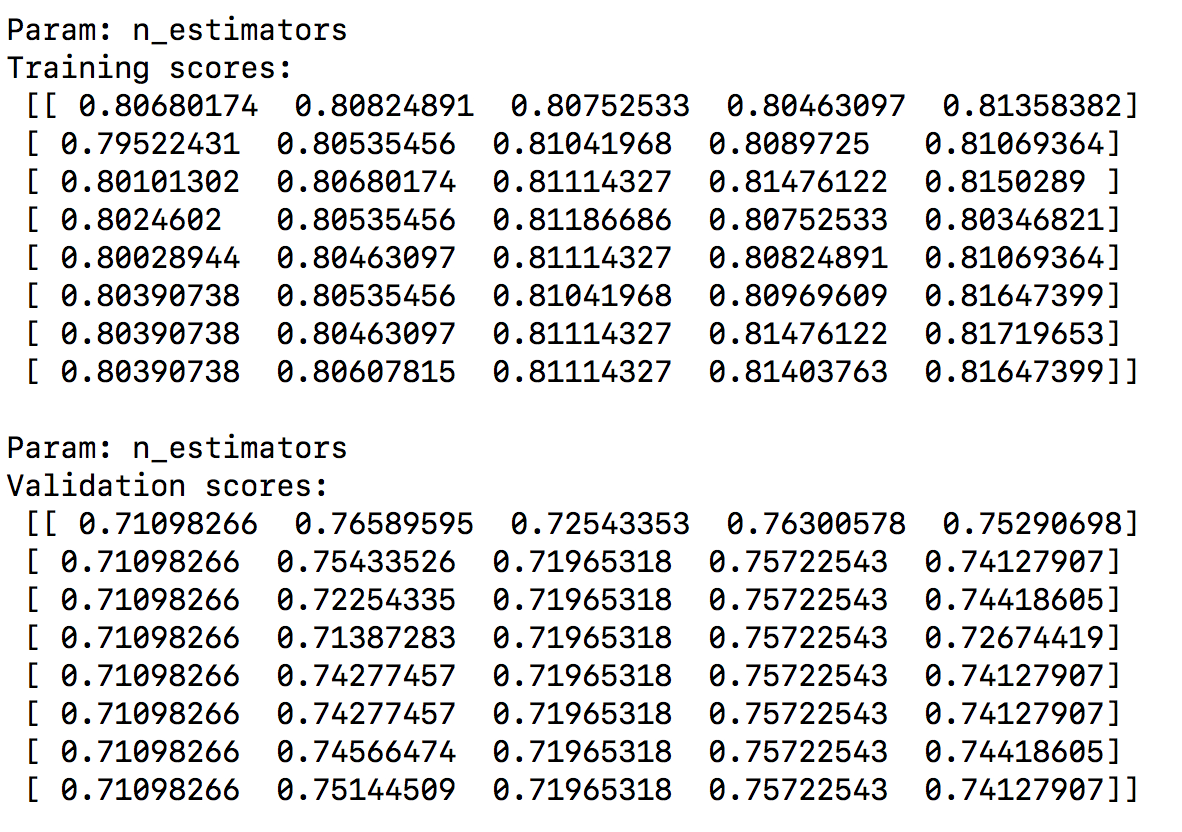
print ("Param: n_estimators\nTraining scores:", train_scores)
print ("Param: n_estimators\nValidation scores:", validation_scores)
在这种情况下, 我们通过固定max_depth参数来定义分类器. 我们要估计要使用的估计的最佳数量, 因此已使用parameter_grid定义了搜索空间. 它将提取训练和验证分数通过从八个步骤25到200迭代.
- 运行结果如下:

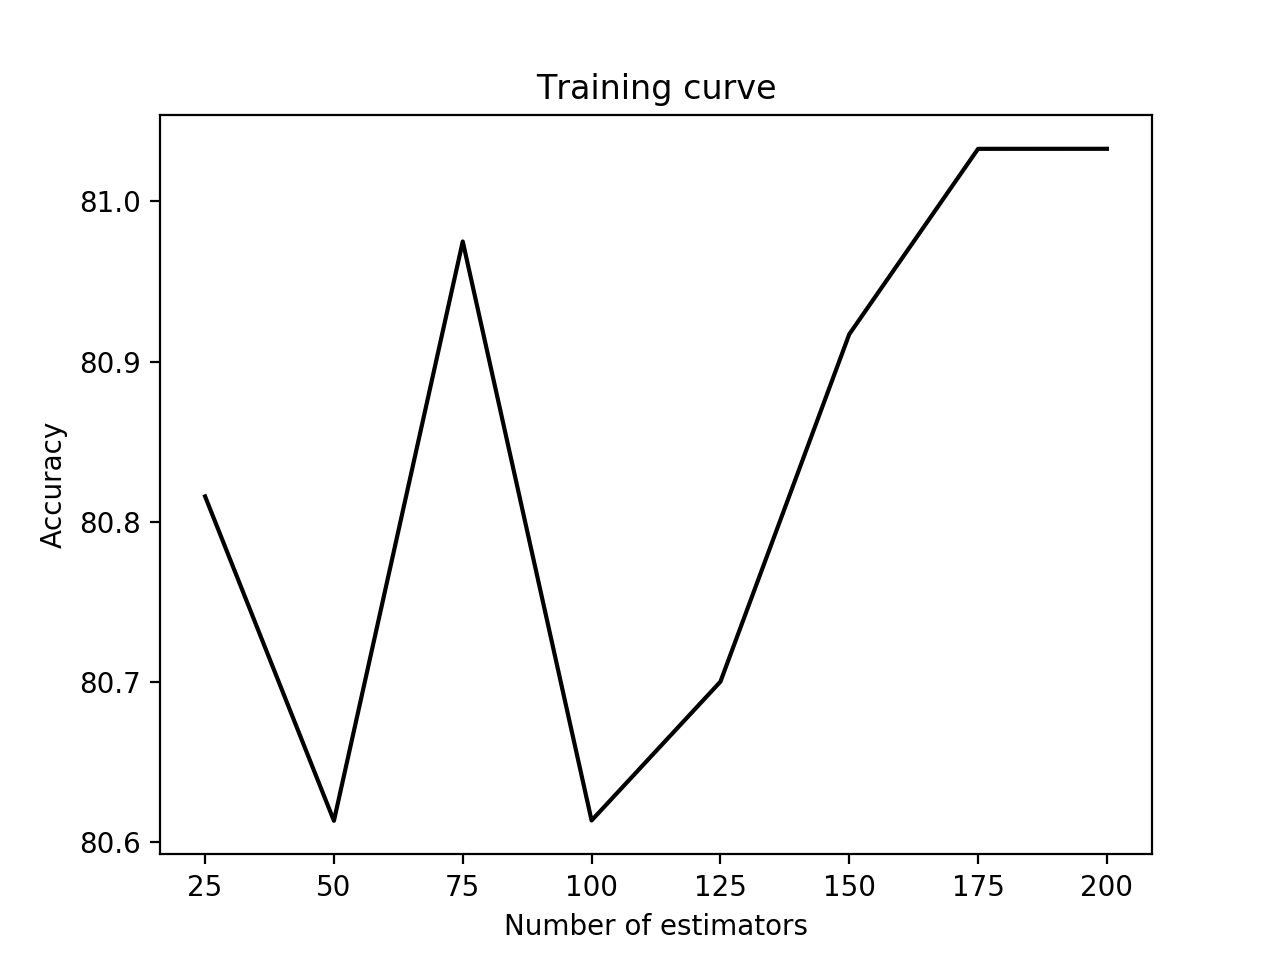
- 绘制图形:
# Plot the curve
plt.figure()
plt.plot(parameter_grid, 100 * np.average(train_scores, axis=1), color='black')
plt.title('Training curve')
plt.xlabel('Number of estimators')
plt.ylabel('Accuracy')
plt.show()
- 结果如下:

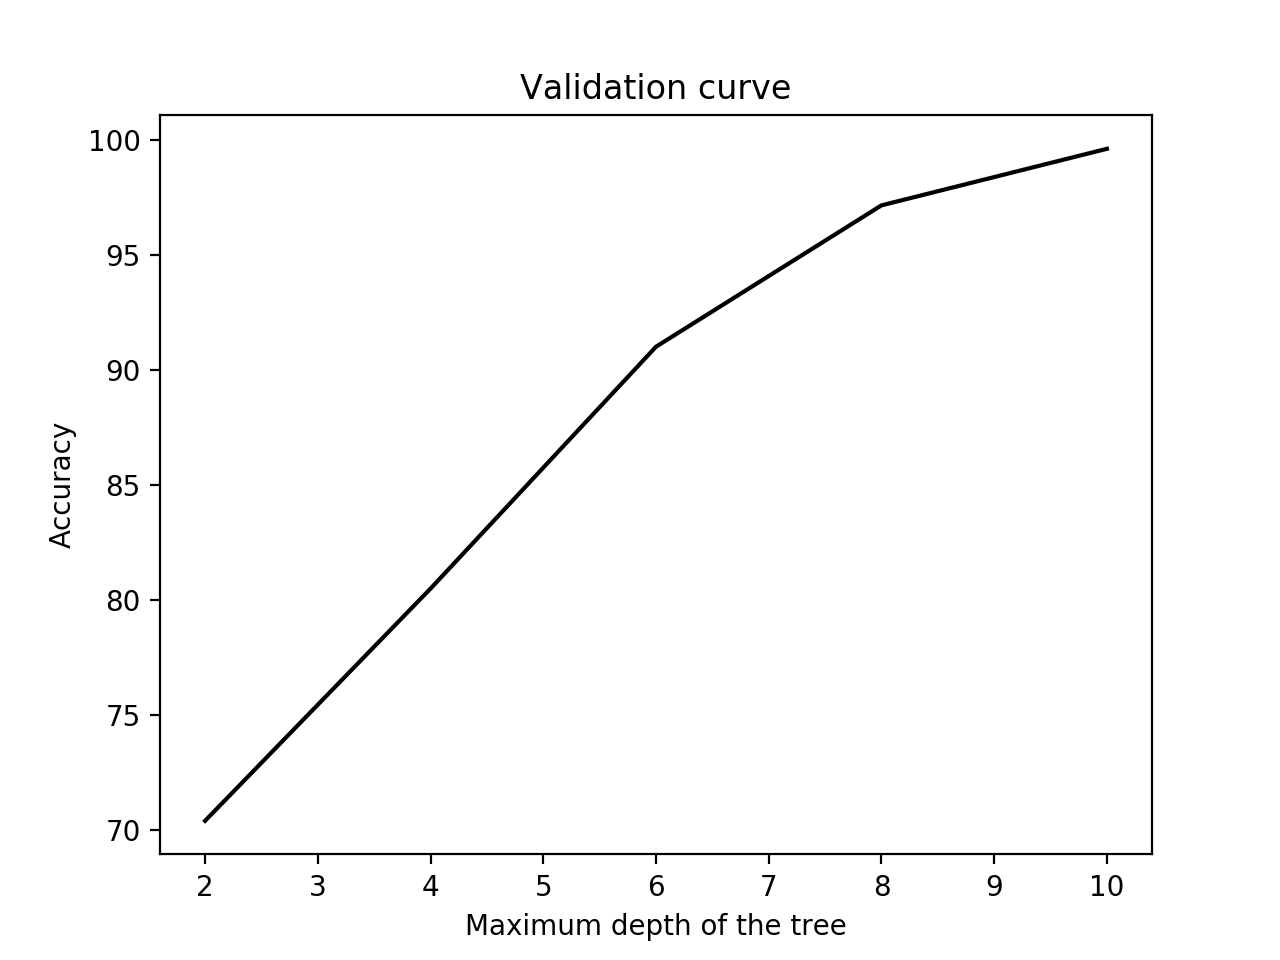
- 让我们对max_depth参数做同样的事情:
classifier = RandomForestClassifier(n_estimators=20, random_state=7)
parameter_grid = np.linspace(2, 10, 5).astype(int)
train_scores, valid_scores = validation_curve(
    classifier,
    X, y,
    "max_depth",
    parameter_grid,
    cv=5
)
print ("\nParam: max_depth\nTraining scores:\n", train_scores)
print ("\nParam: max_depth\nValidation scores:\n", validation_scores)

# Plot the curve
plt.figure()
plt.plot(parameter_grid, 100 * np.average(train_scores, axis=1), color='black')
plt.title('Validation curve')
plt.xlabel('Maximum depth of the tree')
plt.ylabel('Accuracy')
plt.show()
- 结果如下:
