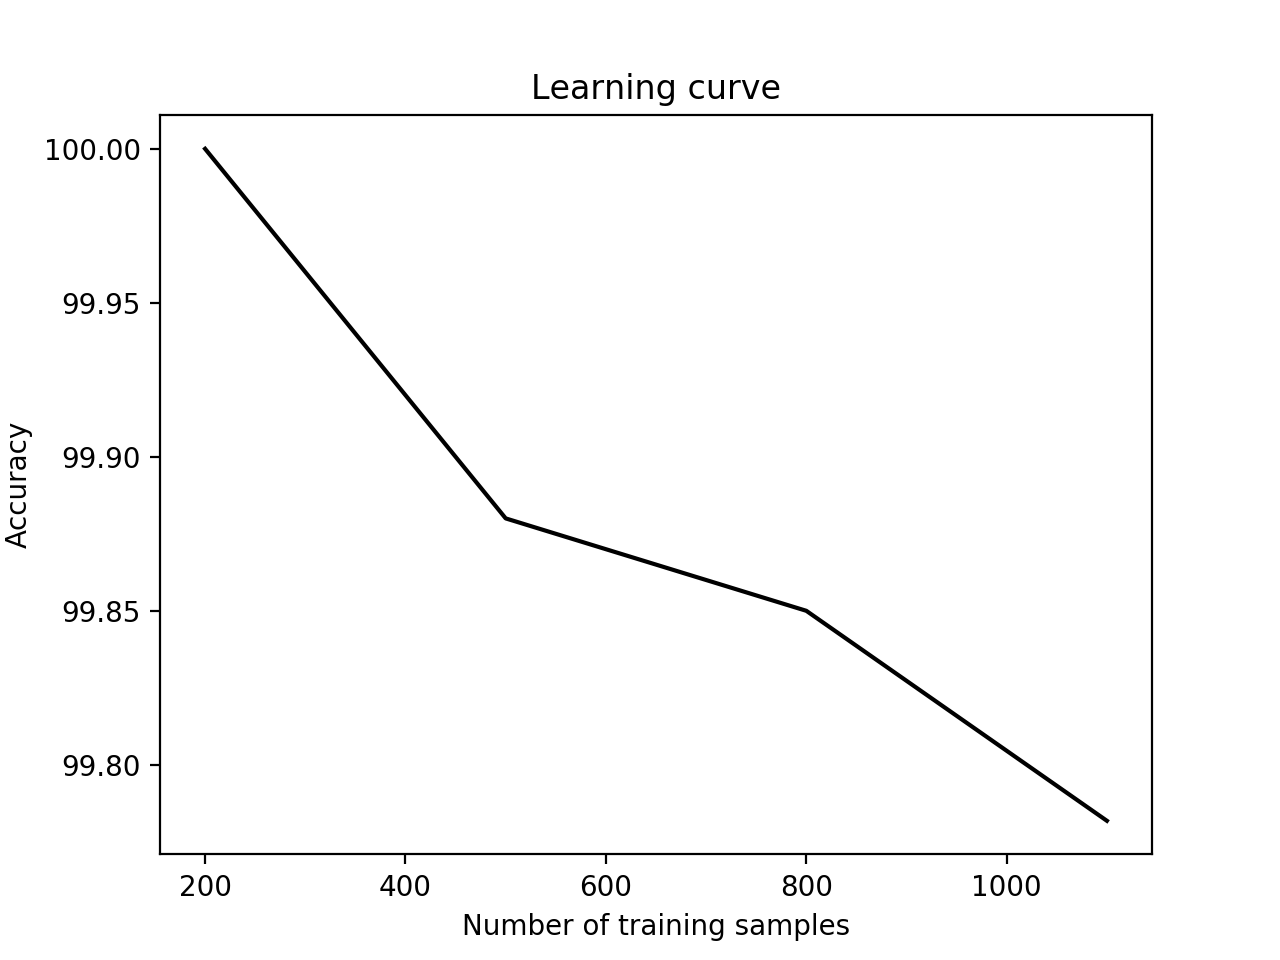
提取学习曲线
学习曲线帮助我们了解我们的训练数据集的大小如何影响机器学习模型. 当你必须处理计算约束时, 这是非常有用的. 让我们继续, 通过改变我们的训练数据集的大小绘制学习曲线.
怎么做...?
- 添加如下代码到上一章的python文件中:
import numpy as np
from sklearn import preproscessing
from sklearn.ensemble import RandomForestClassifier
from sklearn.model_selection import learning_curve
import matplotlib.pyplot as plt

classifier = RandomForestClassifier(random_state=7)

parameter_grid = np.array([200, 500, 800, 1100])
train_sizes, train_scores, validation_scores = learning_curve(
    classifier,
    X, y,
    train_sizes=parameter_grid,
    cv=5
)
print ("\n##### LEARNING CURVES #####")
print ("\nTraining scores:\n", train_scores)
print ("\nValidation scores:\n", validation_scores)

# Plot the curve
plt.figure()
plt.plot(parameter_grid, 100 * np.average(train_scores, axis=1), color='black')
plt.title('Learning curve')
plt.xlabel('Number of training samples')
plt.ylabel('Accuracy')
plt.show()
- 显示结果如下:

虽然较小的训练集似乎提供更好的准确性, 他们很容易过度拟合. 如果我们选择更大的训练数据集, 它会消耗更多的资源. 因此, 我们需要在这里进行权衡以选择合适的训练数据集大小.