最近的邻居模型是指旨在基于训练数据集中最近邻居数量作出决策的一般算法类. 我们来看看如何找到最近的邻居.
怎么做...?
- 新建文件并导入下列包:
import numpy as np
import matplotlib.pyplot as plt
from sklearn.neighbors import NearestNeighbors
- 创建一个二维数据集:
# Input data
X = np.array(
    [
        [1, 1], [1, 3], [2, 2], [2.5, 5], [3, 1],
        [4, 2], [2, 3.5], [3, 3], [3.5, 4]
    ]
)
- 我们的目标是找到任何给定点的三个最接近的邻居. 我们来定义这个参数:
# Number of neighbors we want to find
num_neighbors = 3
- 我们定义一个在输入数据中不存在的随机数据点:
# Input point
input_point = [2.6, 1.7]
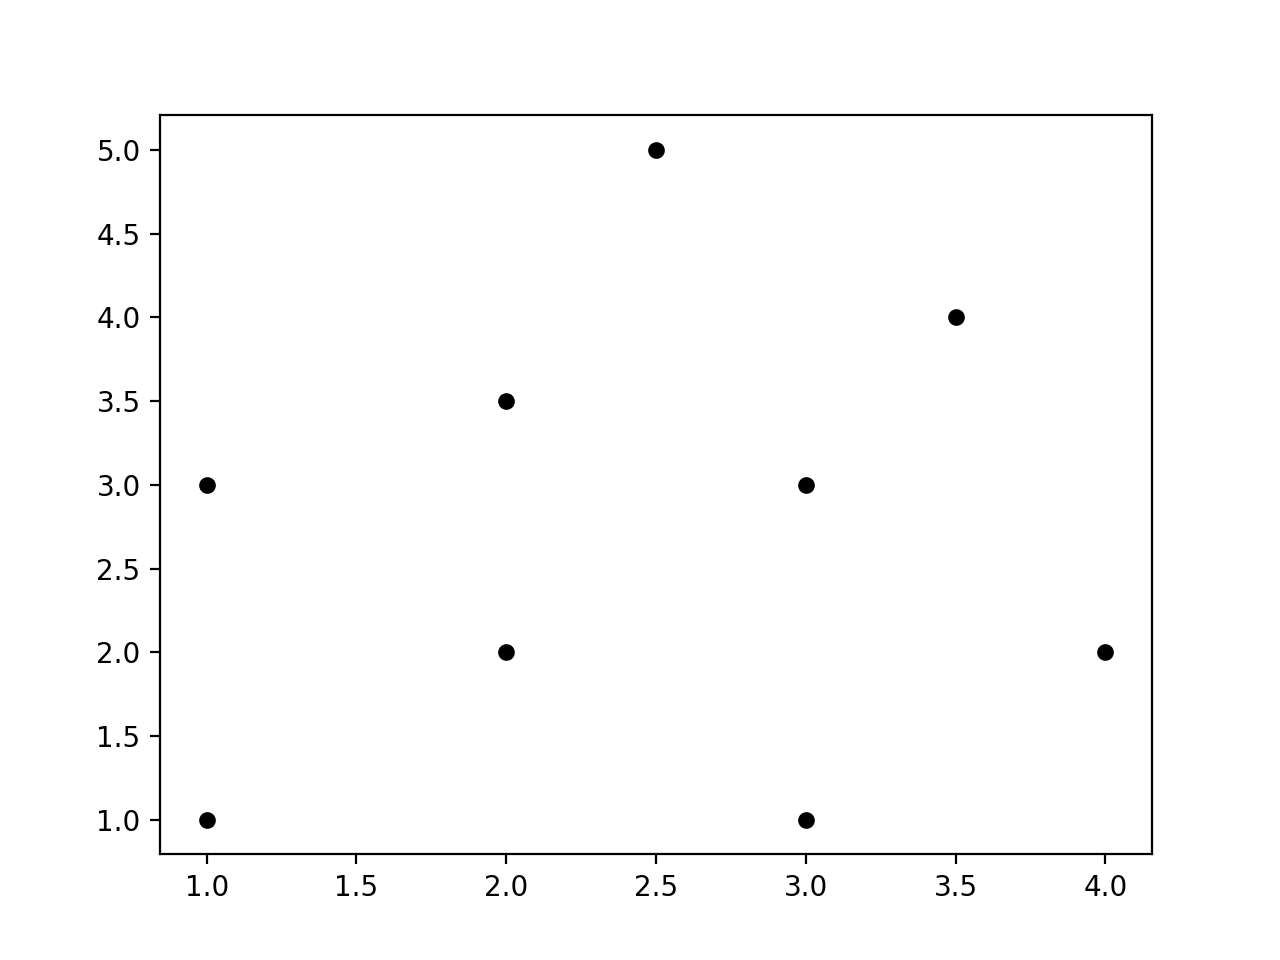
- 我们需要看看这些数据的外观. 我们来绘制, 如下:
# Plot datapoints
plt.figure()
plt.scatter(X[:, 0], X[:, 1], marker='o', s=25, color='k')
- 为了找到最近的邻居, 我们需要使用正确的参数来定义NearestNeighbors对象, 并对输入数据进行训练:
# Build nearest neighbors model
knn = NearestNeighbors(n_neighbors=num_neighbors, algorithm='ball_tree').fit(X)
- 我们现在可以找到输入点到输入数据中所有点的距离:
distances, indices = knn.kneighbors(input_point)
- 我们可以打印k个最近的邻居, 如下所示:
# Print the 'k' nearest neighbors
print ("k nearest neighbors")
for rank, index in enumerate(indices[0][:num_neighbors]):
    print (str(rank + 1) + " -->", X[index])
# indices数组已经被排序, 所以我们只需要解析它并打印数据点
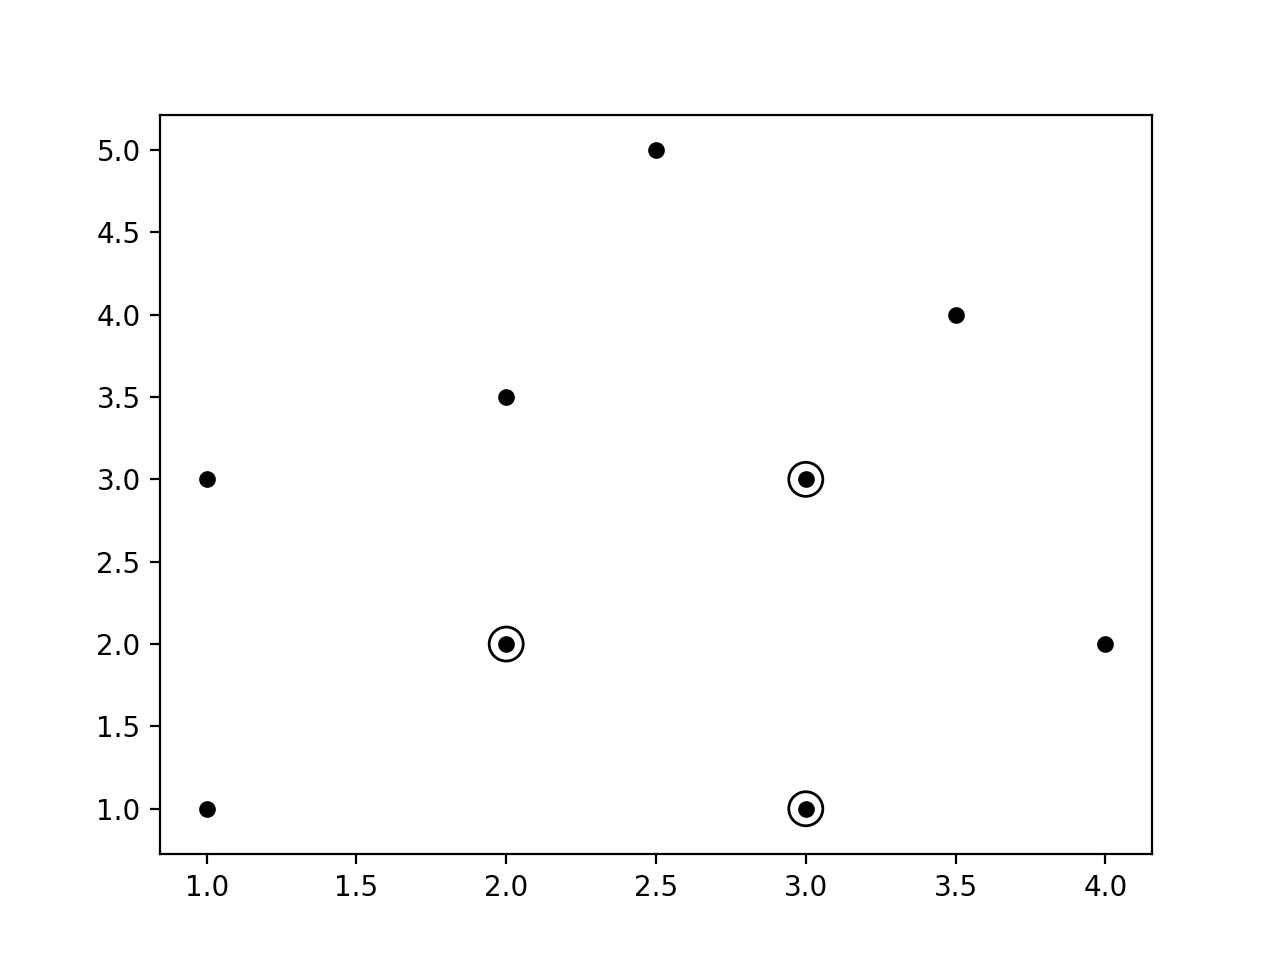
- 我们绘制输入数据点, 并突出显示k个最近的邻居:
# Plot the nearest neighbors
plt.figure()
plt.scatter(X[:, 0], X[:, 1], marker='o', s=25, color='k')
plt.scatter(X[indices][0][:][:, 0], X[indices][0][:][:, 1],
            marker='o', s=150, color='k', facecolors='none')
plt.scatter(input_point[0], input_point[1],
            marker='x', s=150, color='k', facecolors='none')

plt.show()
- 输出结果如下:

- 运行的图形如下:

- 推荐结果如下:
