在谈论聚类聚类之前, 我们需要了解层次聚类. 分层聚类是指通过连续分割或合并构建树状簇的一组聚类算法. 这个层次结构使用树来表示.
分层聚类算法可以是自下而上或自上而下. 这是什么意思? 在自下而上的算法中, 每个数据点被视为具有单个对象的单独集群. 然后将这些集群连续合并, 直到所有的集群合并成一个巨大的集群. 这被称为聚集聚类. 另一方面, 自上而下的算法从一个巨大的簇开始, 并连续地拆分这些簇, 直到达到各个数据点. 您可以在http://nlp.stanford.edu/IR-book/html/htmledition/hierarchical-agglomerative-clustering-1.html上了解更多信息.
怎么做...?
- 该食谱的完整代码在aggregative.py文件中给出. 我们来看看它是如何构建的. 创建一个新的Python文件, 并导入必需的包:
import numpy as np
import matplotlib.pyplot as plt
from sklearn.cluster import AgglomerativeClustering
from sklearn.neighbors import kneighbors_graph
- 我们定义我们需要执行聚集聚类的函数:
def perform_clustering(X, connectivity, title, num_clusters=3, linkage='ward'):
    plt.figure()
    model = AgglomerativeClustering(
        linkage=linkage,
        connectivity=connectivity,
        n_clusters=num_clusters
    )
    model.fit(X)

    # extract labels
    labels = model.labels_

    # specify marker shapes for different clusters
    markers = '.vx'

    for i, marker in zip(range(num_clusters), markers):
        # plot the points belong to the current cluster
        plt.scatter(
            X[labels == i, 0],
            X[labels == i, 1],
            s=50,
            marker=marker,
            color='k',
            facecolors='none'
        )

    plt.title(title)
- 为了证明聚集聚类的优点, 我们需要在空间上链接的数据点上进行运算, 而且在空间上彼此靠近. 我们希望链接的数据点属于相同的集群, 而不是仅在空间上彼此靠近的数据点. 我们定义一个函数来获取一组螺旋上的数据点:
def get_spiral(t, noise_amplitude=0.5):
    r = t
    x = r * np.cos(t)
    y = r * np.sin(t)

    return add_noise(x, y, noise_amplitude)
- 在上一个函数中, 我们添加了一些噪声曲线, 因为它增加了一些不确定性. 我们来定义这个函数:
def add_noise(x, y, amplitude):
    X = np.concatenate((x, y))
    X += amplitude * np.random.randn(2, X.shape[1])
    return X.T
- 我们定义另一个函数来获取位于玫瑰曲线上的数据点:
def get_rose(t, noise_amplitude=0.02):
    # Equation for "rose" (or rhodonea curve); if k is odd, then
    # the curve will have k petals, else it will have 2k petals
    k = 5
    r = np.cos(k * t) + 0.25
    x = r * np.cos(t)
    y = r * np.sin(t)

    return add_noise(x, y, noise_amplitude)
- 只是为了增加更多的品种,我们还要定义一个hypotrochoid
def get_hypotrochoid(t, noise_amplitude=0):
    a, b, h = 10.0, 2.0, 4.0
    x = (a - b) * np.cos(t) + h * np.cos((a - b) / b * t)
    y = (a - b) * np.sin(t) - h * np.sin((a - b) / b * t)

    return add_noise(x, y, 0)
- 下面执行代码:
if __name__ == '__main__':
    # Generate sample data
    n_samples = 500
    np.random.seed(2)
    t = 2.5 * np.pi * (1 + 2 * np.random.rand(1, n_samples))
    X = get_spiral(t)

    # No connectivity
    connectivity = None
    perform_clustering(X, connectivity, 'No connectivity')

    # Create K-Neighbors graph
    connectivity = kneighbors_graph(X, 10, include_self=False)
    perform_clustering(X, connectivity, 'K-Neighbors connectivity')

    plt.show()
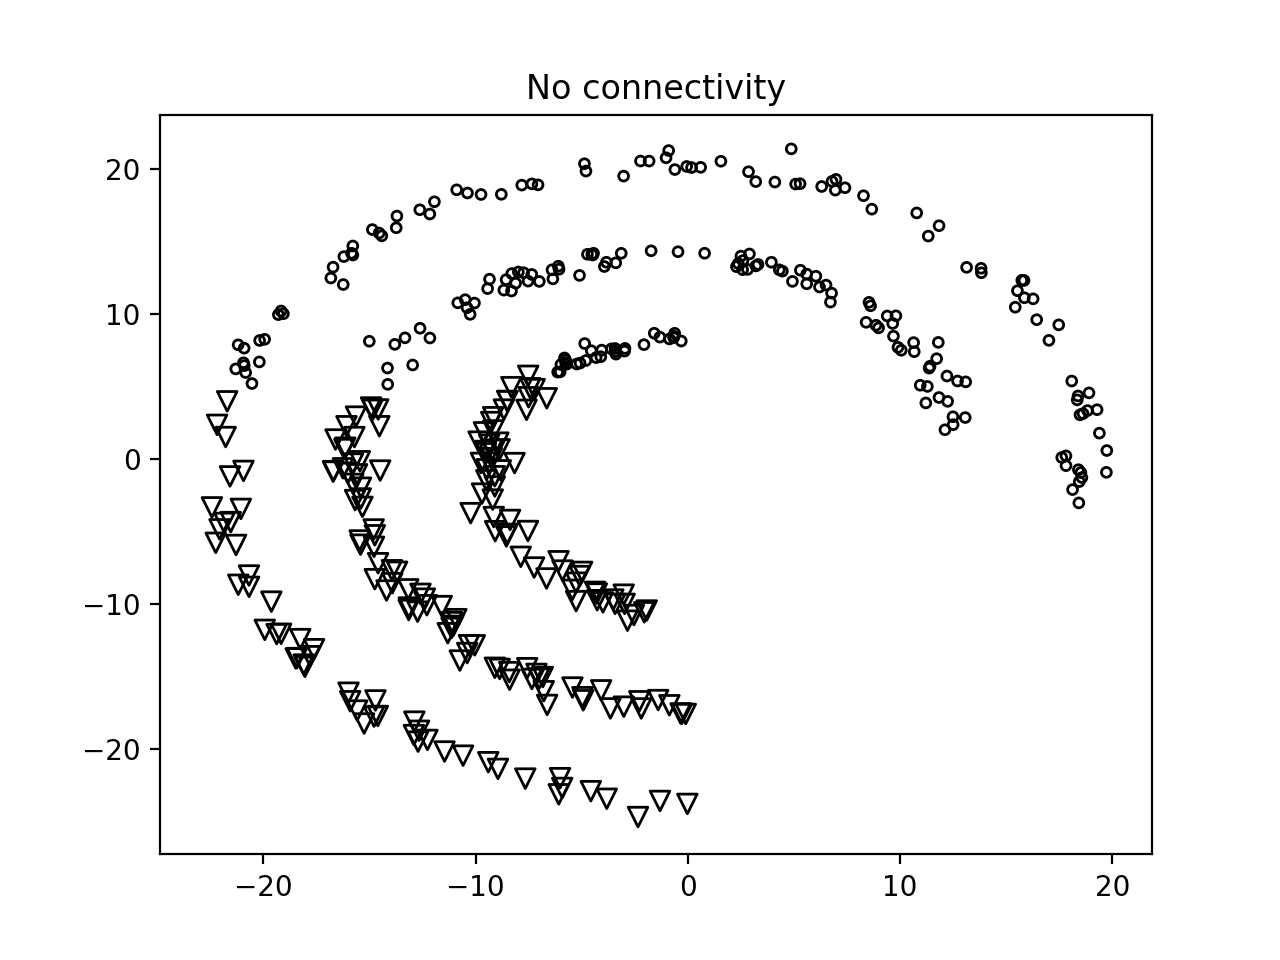
- 如果您运行此代码, 如果我们不使用任何连接(connectivity), 您将获得以下图像:

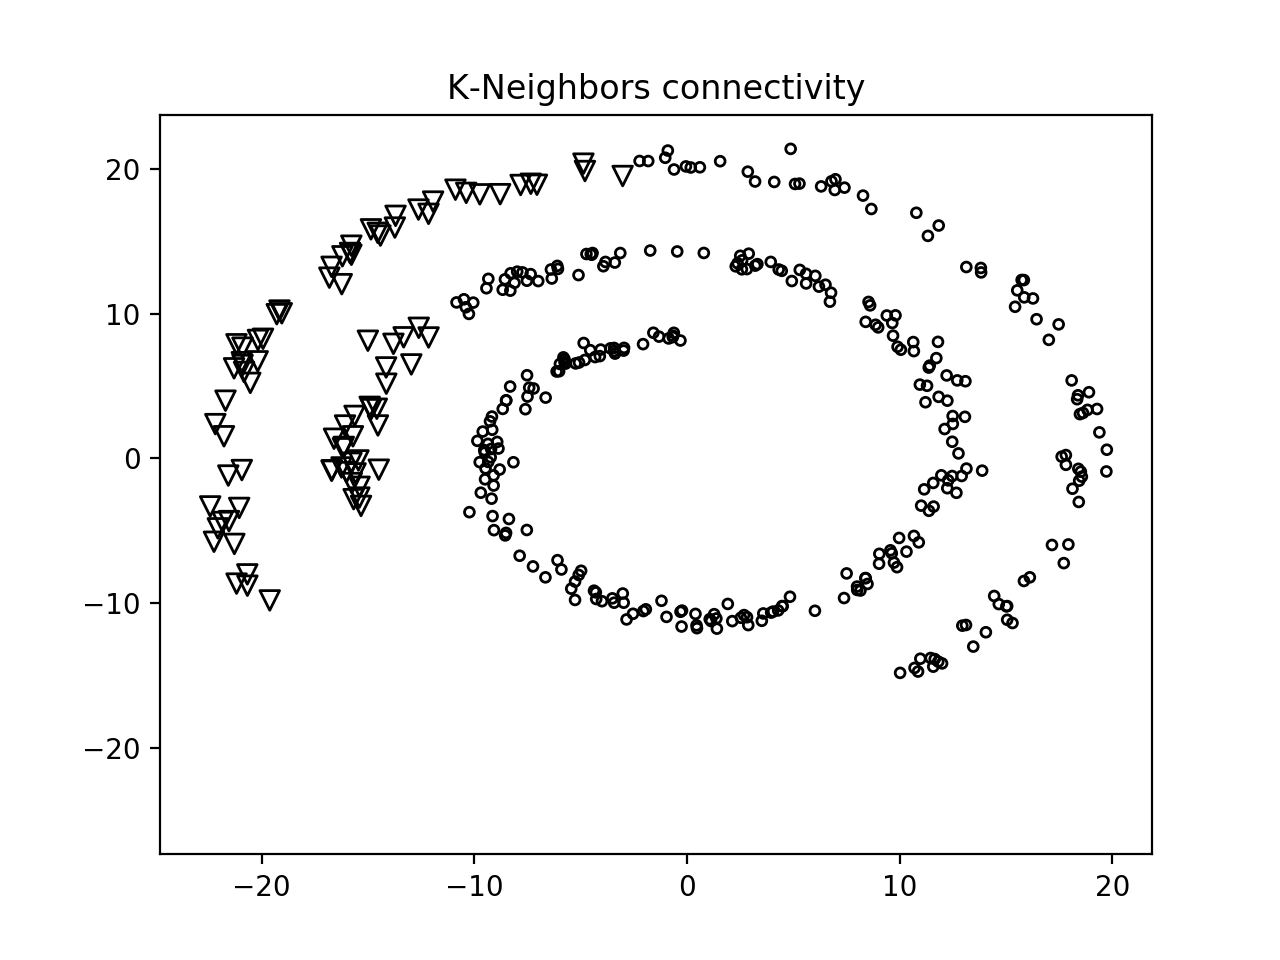
- 第二张图如下图:

我们可以看到, 使用连接功能使我们能够相互链接的组数据点, 而不是根据它们的空间位置进行聚类.