我们学习了如何使用k-nearest neighbors算法构建一个分类器. 我们也可以使用这个算法构建回归. 让我们看看如何使用它作为回归.
怎么做...?
- 创建文件, 并导入需要的包:
import numpy as np
import matplotlib.pyplot as plt
from sklearn import neighbors
- 生成一些样本高斯分布数据:
# Generate sample data
amplitude = 10
num_points = 100
X = amplitude * np.random.rand(num_points, 1) - 0.5 * amplitude
- 我们需要在数据中添加一些噪音来引入一些随机性. 添加噪声的目的是看看我们的算法是否能够超越它, 并且仍然以一种可靠的方式起作用.
# Compute target and add noise
y = np.sinc(X).ravel()
y += 0.2 * (0.5 - np.random.rand(y.size))
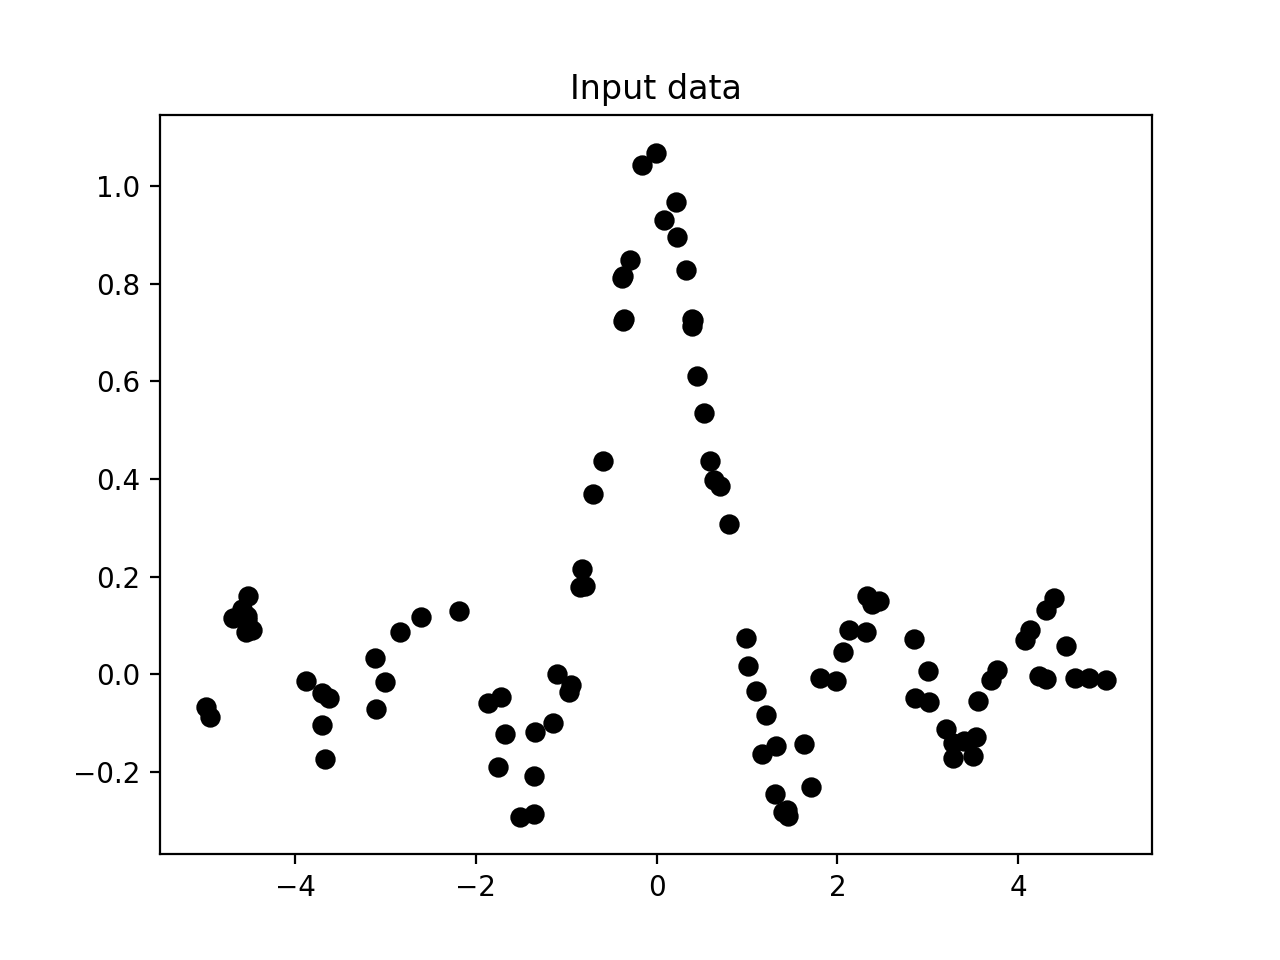
- 数据可视化:
# Plot input data
plt.figure()
plt.scatter(X, y, s=40, c='k', facecolors='none')
plt.title('Input data')
- 我们只是生成了一些样本数据, 并对所有这些点进行了连续值函数的评估. 我们来定义一个更密集的点集:
# Create the 1D grid with 10 times the density of the input data
x_values = np.linspace(
    -0.5 * amplitude,
    0.5 * amplitude,
    10 * num_points
)[:, np.newaxis]
# We defined this denser grid because we want to evaluate our regressor on all these points and look at how well it approximates our function
- 我们来定义我们想要考虑的最近邻居的数量:
# Number of neighbors to consider
n_neighbors = 8
- 我们使用我们之前定义的参数来初始化和训练k个最近的邻居回归:
# Define and train the regressor
knn_regressor = neighbors.KNeighborsRegressor(n_neighbors, weights='distance')
y_values = knn_regressor.fit(X, y).predict(x_values)
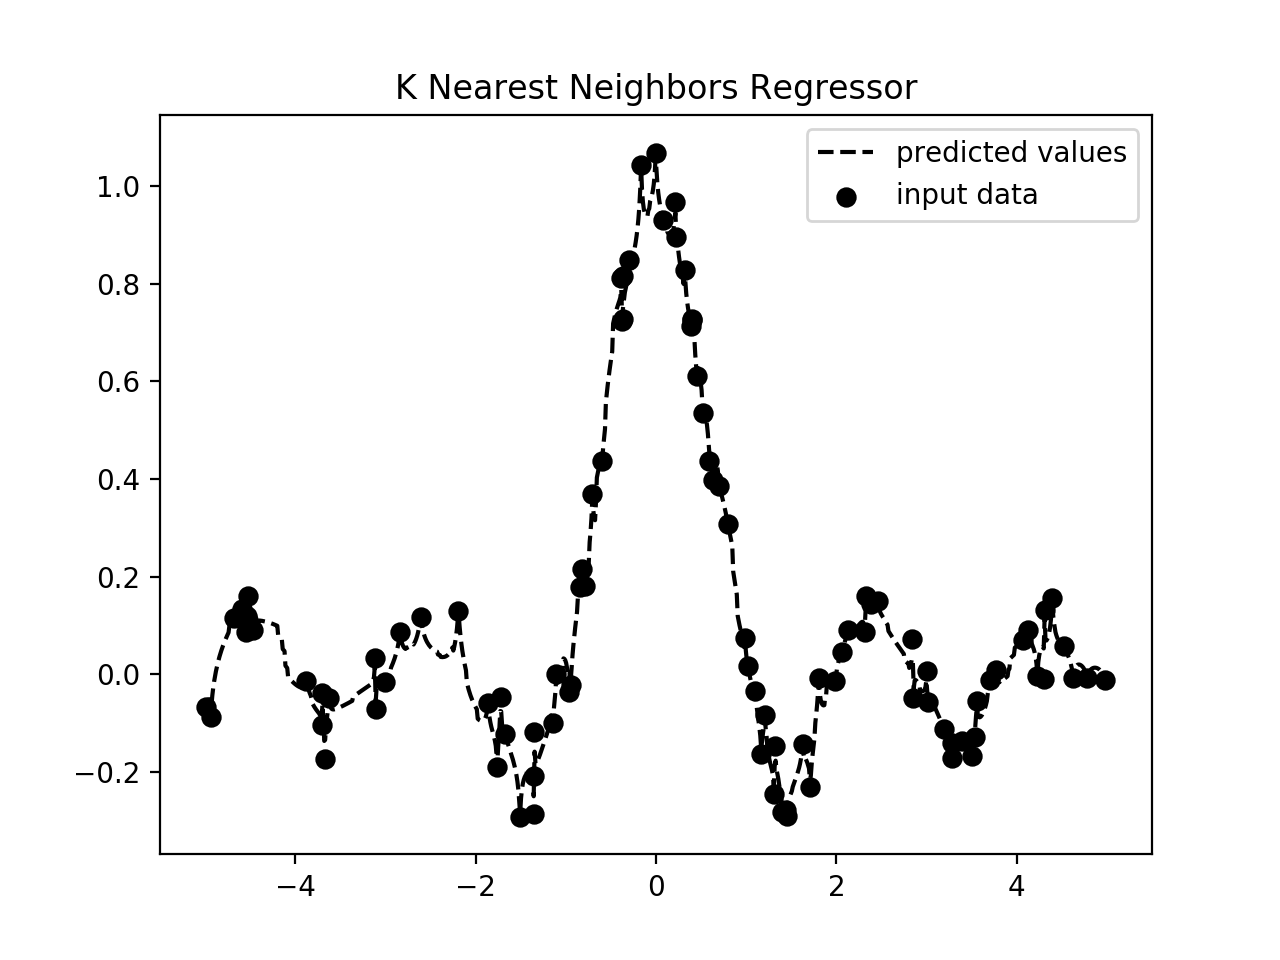
- 让我们看看回归器如何通过将输入和输出数据重叠在一起来实现:
plt.figure()
plt.scatter(X, y, s=40, c='k', facecolors='none', label='input data')
plt.plot(x_values, y_values, c='k', linestyle='--', label='predicted values')
plt.xlim(X.min() - 1, X.max() + 1)
plt.ylim(y.min() - 0.2, y.max() + 0.2)
plt.axis('tight')
plt.legend()
plt.title('K Nearest Neighbors Regressor')

plt.show()
- 如果你运行这个代码, 第一个数字描绘了输入数据点如下:

- 第二张图片描绘了回归者的预测值:

原理...?
回归的目标是预测连续价值的产出. 在这种情况下, 我们没有固定数量的输出类别. 我们只有一组实值输出值, 我们希望我们的回归器预测未知数据点的输出值. 在这种情况下, 我们使用 sinc 函数来演示k-最近邻居回归. 这也被称为基数正弦函数. sinc 函数由以下定义:
sinc(x) = sin(x)/x when x is not 0
= 1 when x is 0
当x为0时,sin(x) / x取 0/0 的不确定形式. 因此, 我们必须计算这个函数的极限, 因为x趋于0. 我们使用一组值进行训练, 我们定义了一个更密集的网格进行测试. 如上图所示, 输出曲线接近训练输出.